GOD'S LAW ON SEXUALITY WOULD ELIMINATE ALL THIS
WHAT LAWS?
SIMPLE----
NO SEX BEFORE MARRIAGE, CALLED FORNICATION IN THE BIBLE
NO EXTRA MARITAL SEX, CALLED ADULTERY IN THE BIBLE.
Keith Hunt
National Overview
PrintNational Overview of STDs, 2020
As noted in the 2021 National Academies of Sciences Engineering and Medicine report, Sexually Transmitted Infections: Adopting a Sexual Health Paradigm, surveillance is key to understanding the magnitude of sexually transmitted infections in the United States and in subpopulations that are most affected.1 The 2020 STD Surveillance Report provides trends in STDs to describe current epidemiology of nationally notifiable STDs and inform prevention and control strategies. This overview summarizes national surveillance data for 2020 on the three notifiable diseases for which there are federally funded control programs: chlamydia, gonorrhea, and syphilis.
The COVID-19 pandemic has introduced uncertainty and difficulty in interpreting STD surveillance data collected during 2020 and trends presented in Sexually Transmitted Disease Surveillance, 2020should be interpreted cautiously. For more information, please see Impact of COVID-19 on STDs.
In 2020, a total of 1,579,885 cases of Chlamydia trachomatis infection were reported to the CDC, making it the most common notifiable sexually transmitted infection in the United States for that year. This case count corresponds to a rate of 481.3 cases per 100,000 population, a decrease of 13% compared with the rate in 2019. During 2019–2020, rates of reported chlamydia decreased among both males and females, in all regions of the United States, and, except for rates among non-Hispanic persons of multiple races, among all racial/Hispanic ethnicity groups.
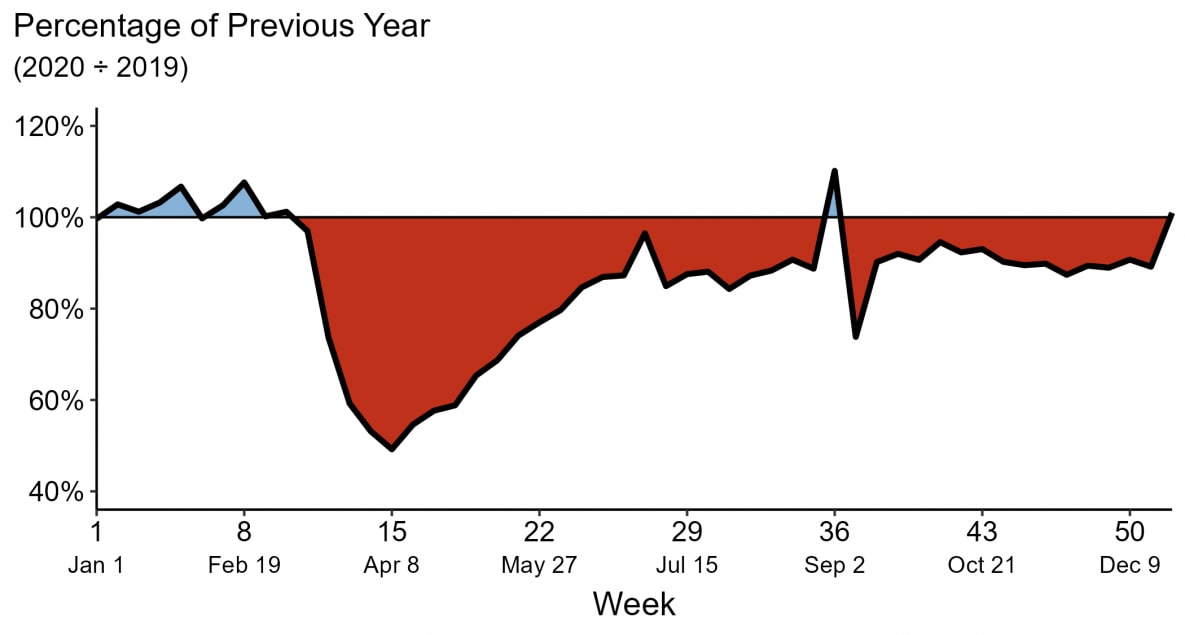
Decreases in rates of reported chlamydia in 2020 are unlikely due to a reduction in new infections. As chlamydial infections are usually asymptomatic, case rates are heavily influenced by screening coverage. During the COVID-19 pandemic, many health care clinics limited in-person visits to patients with symptoms or closed entirely, and it is likely that preventive health care visits where STD screening usually happens, such as annual reproductive health visits for young women, decreased. During the initial shelter-in-place orders in March and April of 2020, the number of chlamydia cases decreased substantially when compared to the number of cases reported in 2019 and the deficit persisted throughout the year.
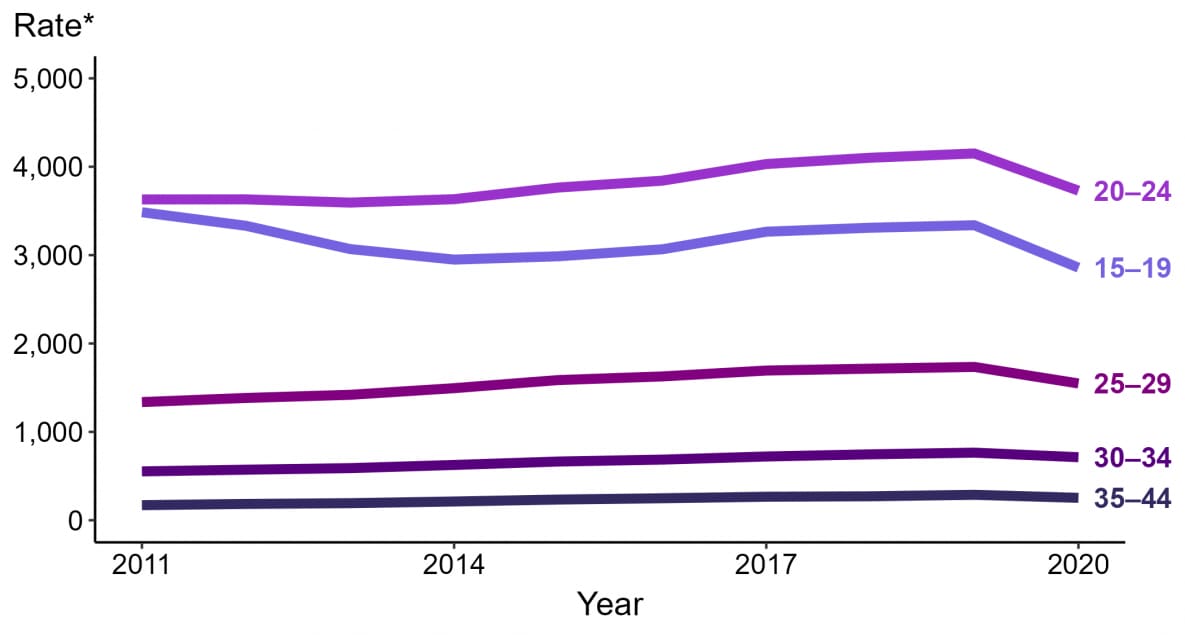
Rates of reported chlamydia are highest among adolescents and young adults. In 2020, almost two-thirds (61%) of all reported chlamydia cases were among persons aged 15–24 years. Decreases in rates of diagnosed and reported chlamydia during 2020 were most noticeable among females aged 15–24 years, one of the populations targeted for chlamydia screening. Although still high, rates of reported chlamydia decreased 15% among 15–19-year-old females and decreased 10% among 20–24-year-old females during 2019–2020.
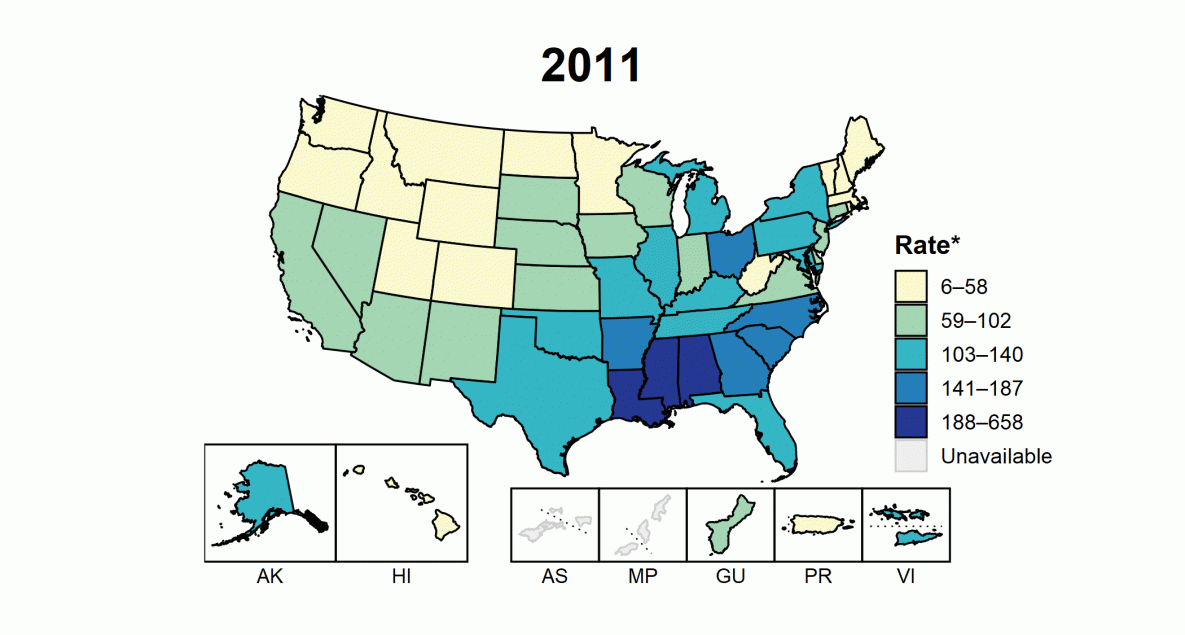
In 2020, a total of 677,769 cases of gonorrhea were reported to the CDC, making it the second most common notifiable sexually transmitted infection in the United States for that year. Rates of reported gonorrhea have increased 111% since the historic low in 2009. During 2019–2020, the overall rate of reported gonorrhea increased 5.7%. During 2019–2020, rates increased among both males and females and in three regions of the United States (Midwest, Northeast, and South). Rates of reported gonorrhea increased in most racial/Hispanic ethnicity groups, with the greatest increases observed among non-Hispanic Black/African American persons and non-Hispanic persons of multiple races.
During the initial shelter-in-place orders in March and April of 2020, the weekly number of cases of reported gonorrhea was lower compared to counts in 2019; however, later in the year, the number of reported gonorrhea cases increased. Reasons for the increase are unclear but may have resulted from increased service utilization as health care clinics re-opened or increased transmission later in the year. During 2019–2020, rates of reported gonorrhea increased in 36 states and two US territories.
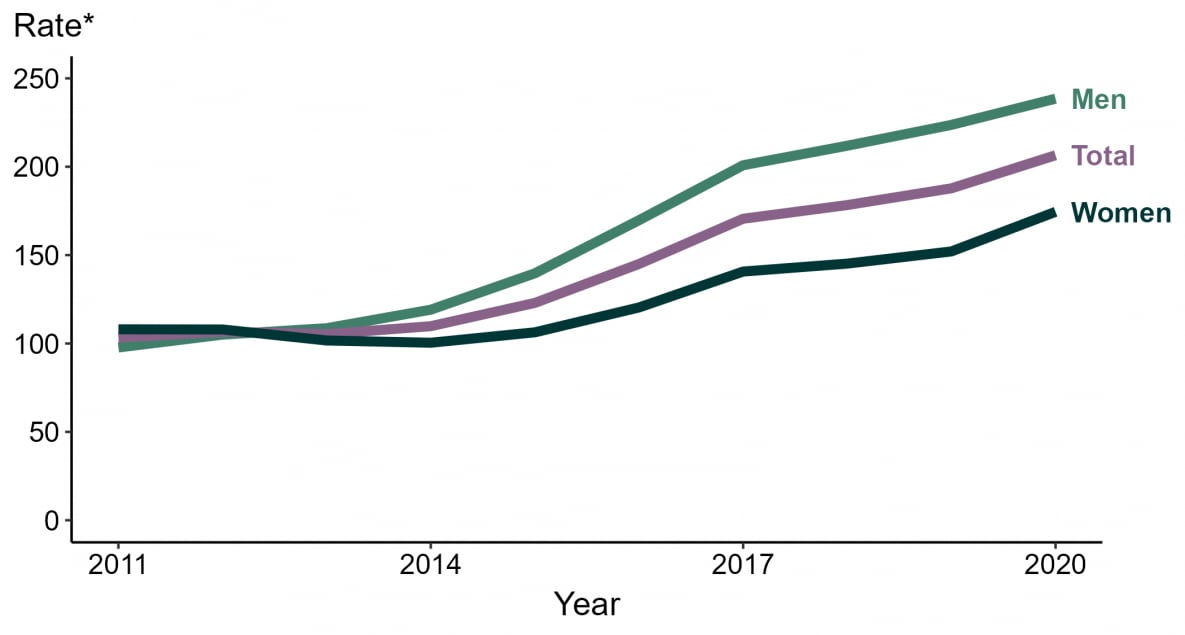
Rates of reported gonorrhea have increased since 2009 and since 2013, rates have been higher among men compared to women, likely reflecting cases identified in both men who have sex with men (MSM) and men who have sex with women only. Although there are limited data available on sexual behaviors of persons reported with gonorrhea at the national level, enhanced data from jurisdictions participating in a sentinel surveillance system, the STD Surveillance Network (SSuN), suggest that about a third of gonorrhea cases occurred among MSM in 2020. During 2019–2020, rates increased among both men and women, but increases were greater among women (15%) compared to men (6.6%) which may reflect differences in diagnosing and reporting of cases among MSM in 2020. As extragenital infections are often asymptomatic and are likely identified by screening, diagnoses among MSM may have been reduced in 2020 due to the effect of COVID-19 on screening coverage.
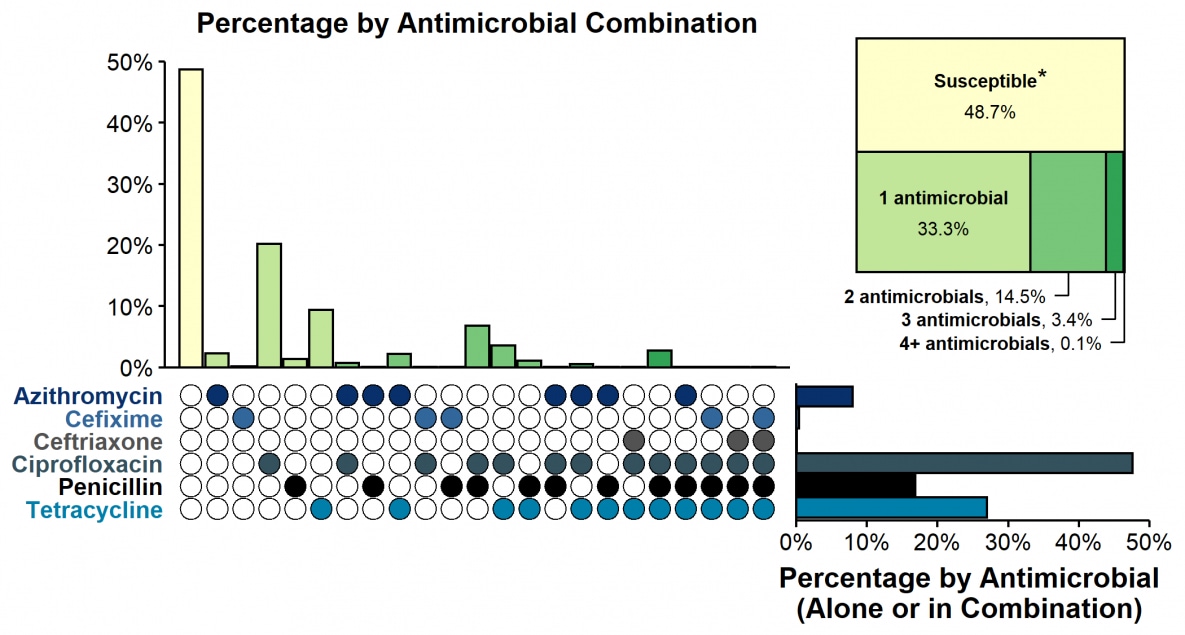
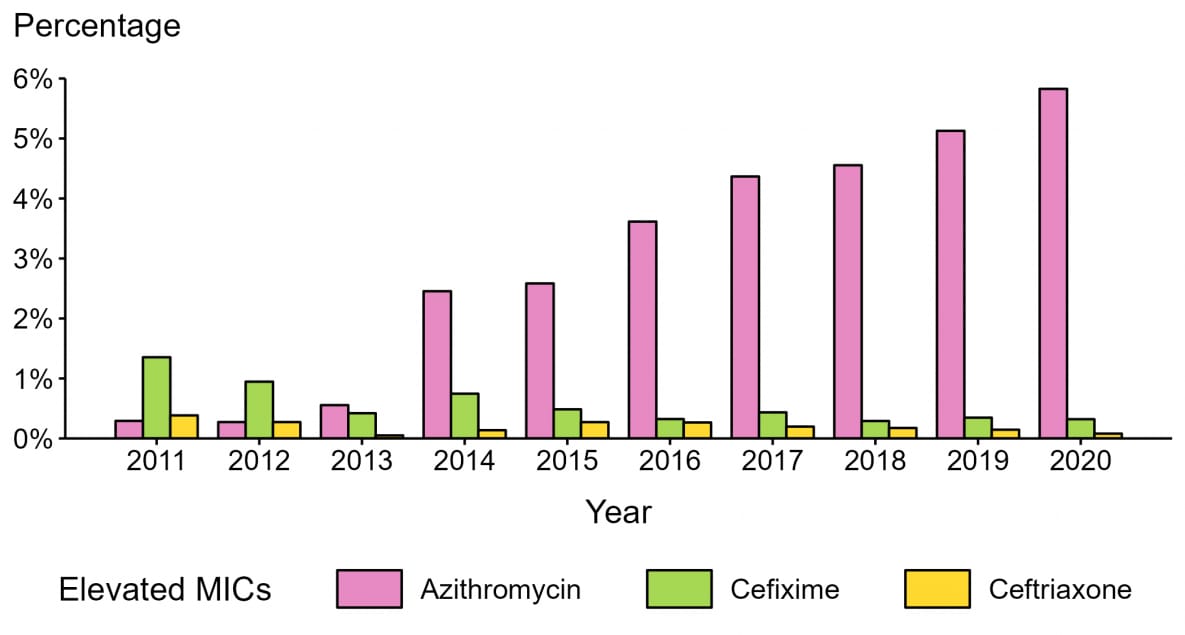
Gonorrhea can quickly develop resistance to antibiotics used to treat infection, and in 2020, about half of all infections were estimated to be resistant to at least one antibiotic. Since 2010, almost all circulating strains in the United States, based on gonococcal isolates collected through sentinel surveillance in the Gonococcal Isolate Surveillance Project (GISP), remain susceptible to ceftriaxone, the primary treatment for gonorrhea; only 0.1% of isolates displayed elevated ceftriaxone minimum inhibitory concentrations (MICs) in 2020. In 2020, 5.8% of isolates had elevated azithromycin MICs; the proportion was higher among MSM compared to men who have sex with women only (9.2% vs 4.3%). Continued monitoring of susceptibility patterns to antibiotics is critical to inform gonorrhea treatment guidelines.
Despite significant disruptions in access to health care in 2020, most reported gonorrhea cases received the recommended treatment in jurisdictions participating in a sentinel surveillance system, the STD Surveillance Network (SSuN). In December of 2020, CDC released updated gonorrhea treatment guidelines, recommending a single 500 mg intramuscular dose of ceftriaxone for uncomplicated gonorrhea.2 Continued surveillance of treatment practices is a critical public health priority to help assure that patients receive the highest quality of care, and to address the emerging threat of antimicrobial-resistant gonorrhea.
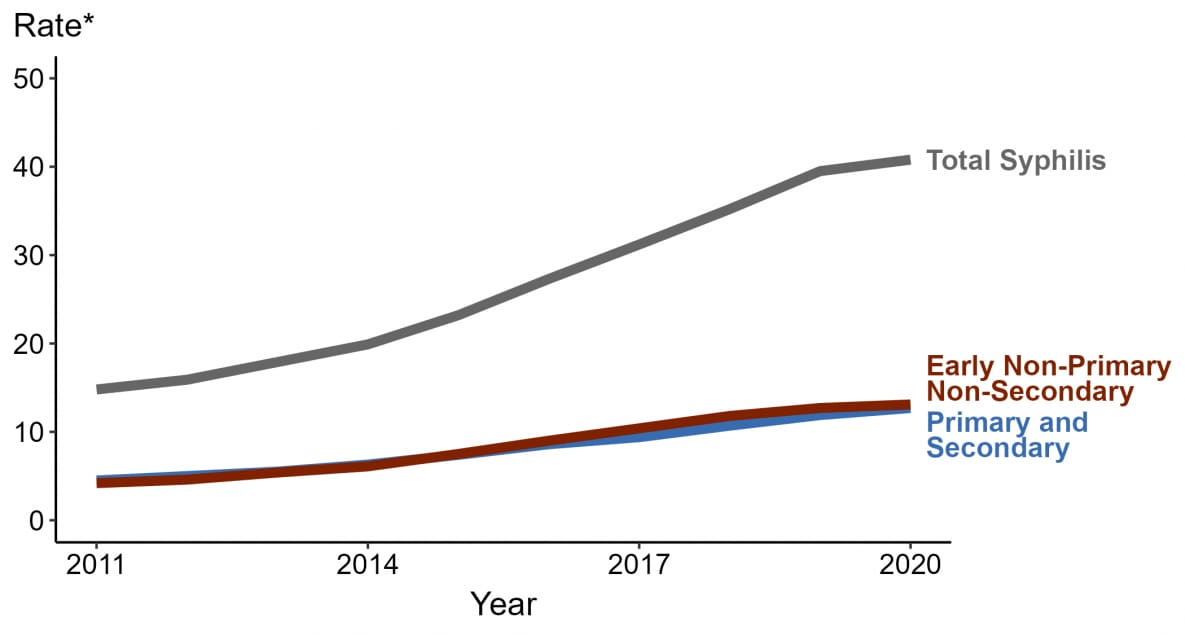
In 2020, 133,945 cases of all stages of syphilis were reported, including 41,655 cases of primary and secondary (P&S) syphilis, the most infectious stages of the disease. Since reaching a historic low in 2000 and 2001, the rate of P&S syphilis has increased almost every year, increasing 6.8% during 2019–2020. Rates increased among both males and females and in three regions of the United States (Midwest, Northeast, and South). Rates of P&S syphilis increased in most racial/Hispanic ethnicity groups, with greatest increases among non-Hispanic American Indian/Alaska Native persons and non-Hispanic persons of multiple races.
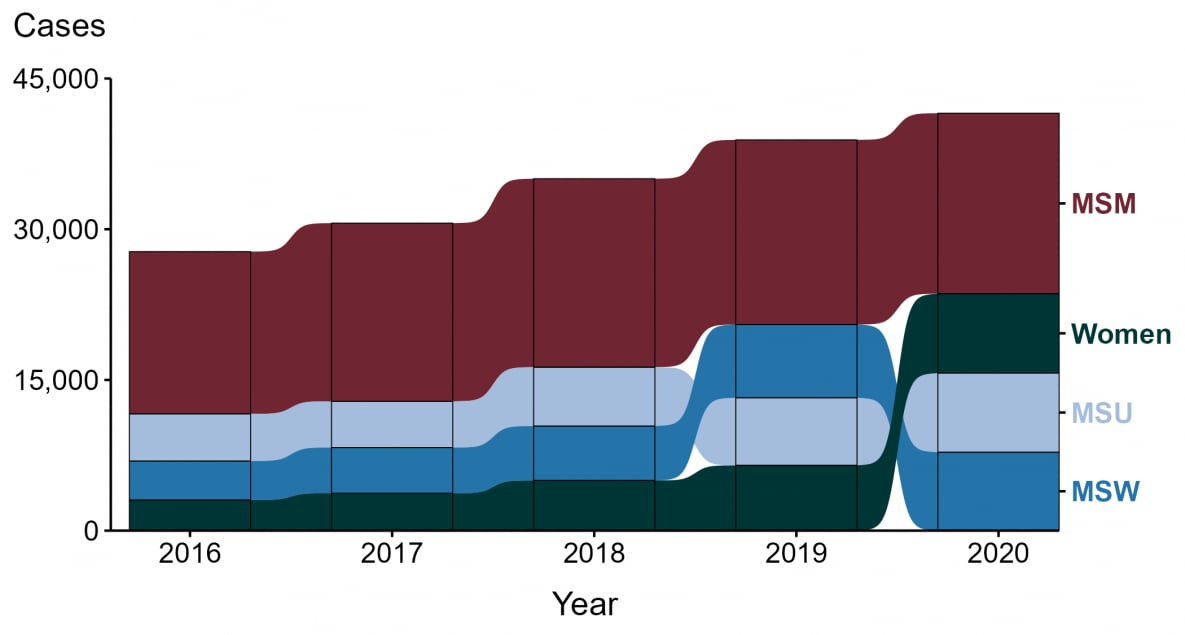
Since 2000, rates of P&S syphilis have increased among men, likely attributable to increases in cases among MSM; however, increases among MSM have slowed in recent years and during 2019-2020, the number of cases of P&S syphilis among MSM decreased 2.2%. Still, MSM are disproportionately impacted, accounting for a majority (53%) of all male P&S syphilis cases in 2020 and in states with complete information on sex of sex partners for male cases, rates of P&S syphilis among MSM increased in 18 states during 2019–2020. Although rates of P&S syphilis are lower among women, rates have increased substantially in recent years, increasing 21% during 2019–2020 and 147% during 2016–2020, suggesting that the heterosexual syphilis epidemic continues to rapidly increase in the United States.
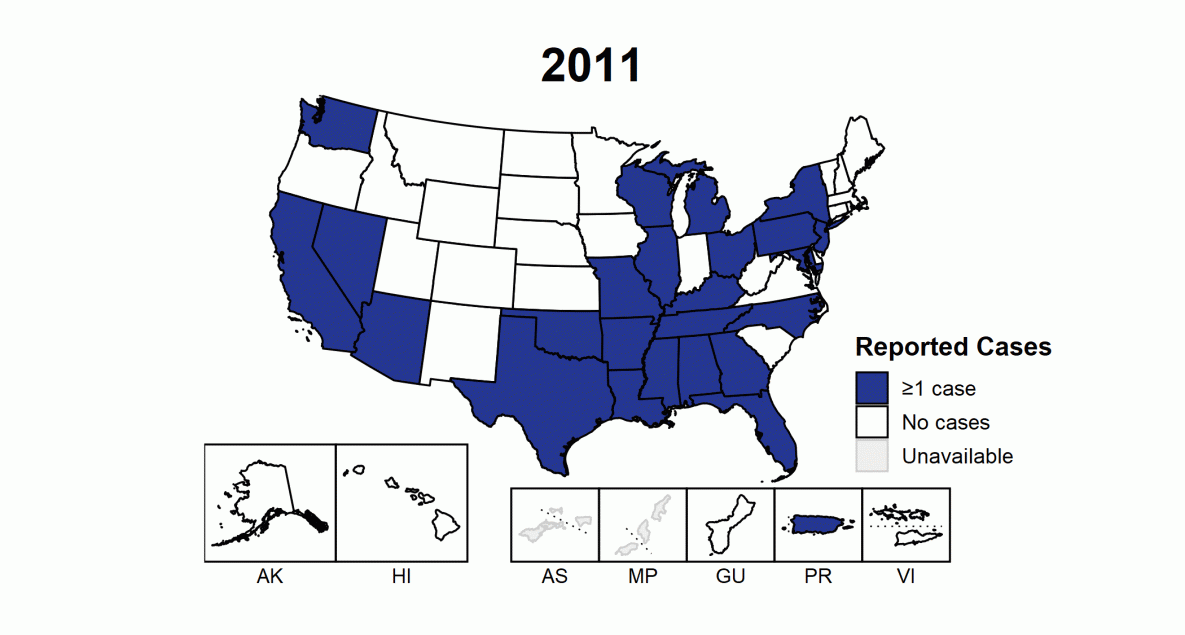
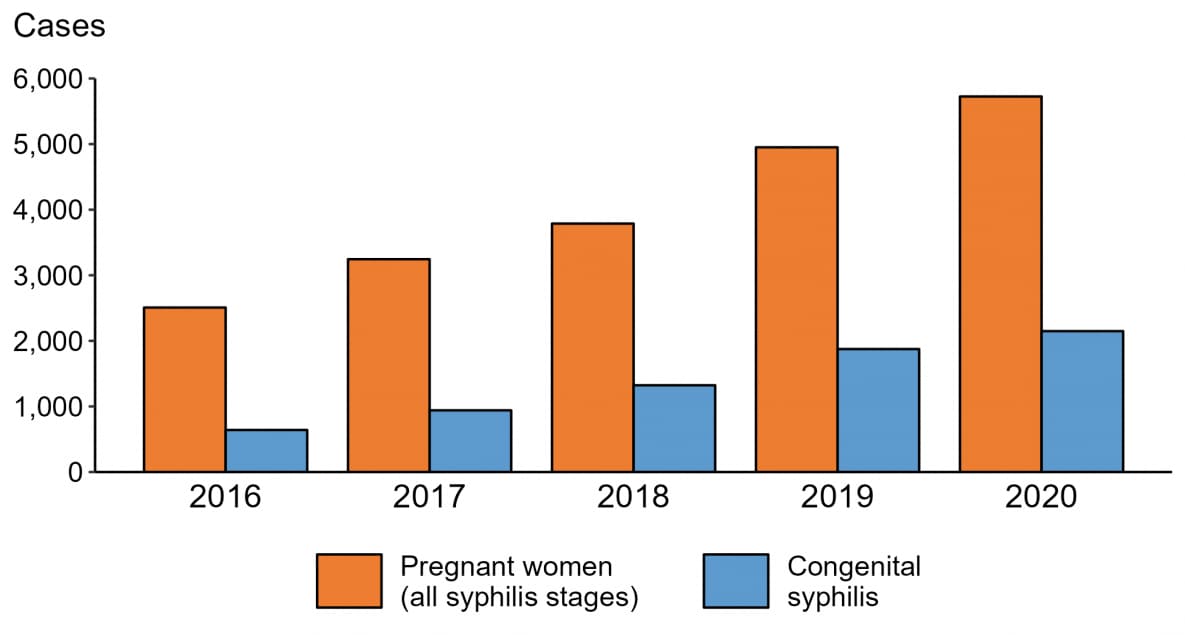
The 2013 rate of congenital syphilis (9.2 cases per 100,000 live births) marked the first increase in congenital syphilis since 2008. Since 2013, the rate of congenital syphilis has increased each year. In 2020, 2,148 cases of congenital syphilis were reported, including 149 congenital syphilis-related stillbirths and infant deaths. Although the majority of congenital syphilis cases were reported from a few states, 49 jurisdictions (47 states, the District of Columbia, and one US territory) reported at least one case of congenital syphilis in 2020, up from just 26 jurisdictions in 2011.
The national congenital syphilis rate of 57.3 cases per 100,000 live births in 2020 represents a 15% increase relative to 2019 and 254% increase relative to 2016. These increases mirror increases in syphilis among reproductive aged women. During 2019–2020 the rate of P&S syphilis increased 24% among women aged 15–44 years. In 2020, there were 5,726 cases of syphilis (all stages) diagnosed among pregnant women, an increase of 16% from 2019.
As in past years, there were significant disparities in rates of reported STDs. In 2020, over half (53%) of reported cases of STDs were among adolescents and young adults aged 15–24 years. Disparities continue to persist in rates of reported STDs among some racial minority or Hispanic groups when compared with rates among non-Hispanic White persons. In 2020, 32% of all cases of chlamydia, gonorrhea, and P&S syphilis were among non-Hispanic Black persons, even though they made up only approximately 12% of the US population.3 MSM are disproportionally impacted by STDs, including P&S syphilis and gonorrhea.
It is important to note that these disparities are unlikely explained by differences in sexual behavior and rather reflect differential access to quality sexual health care, as well as differences in sexual network characteristics. For example, in communities with higher prevalence of STDs, with each sexual encounter, people face a greater chance of encountering an infected partner than those in lower prevalence settings do, regardless of similar sexual behavior patterns. Acknowledging inequities in STD rates is a critical first step toward empowering affected groups and the public health community to collaborate in addressing systemic inequities in the burden of disease — with the ultimate goal of minimizing the health impacts of STDs on individuals and populations.
- National Academies of Sciences, Engineering, and Medicine 2021. Sexually Transmitted Infections: Adopting a Sexual Health Paradigm. Washington, DC: The National Academies Press. https://doi.org/10.17226/25955
- St. Cyr S, Barbee L, Workowski KA, et al. Update to CDC’s Treatment Guidelines for Gonococcal Infection, 2020. MMWR Morb Mortal Wkly Rep 2020;69:1911–1916. DOI: http://dx.doi.org/10.15585/mmwr.mm6950a6
- U.S. Census. 2020 U.S. Population More Racially and Ethnically Diverse Than Measured in 2010. Available at: https://www.census.gov/library/stories/2021/08/2020-united-states-population-more-racially-ethnically-diverse-than-2010.html
No comments:
Post a Comment